WER Medical
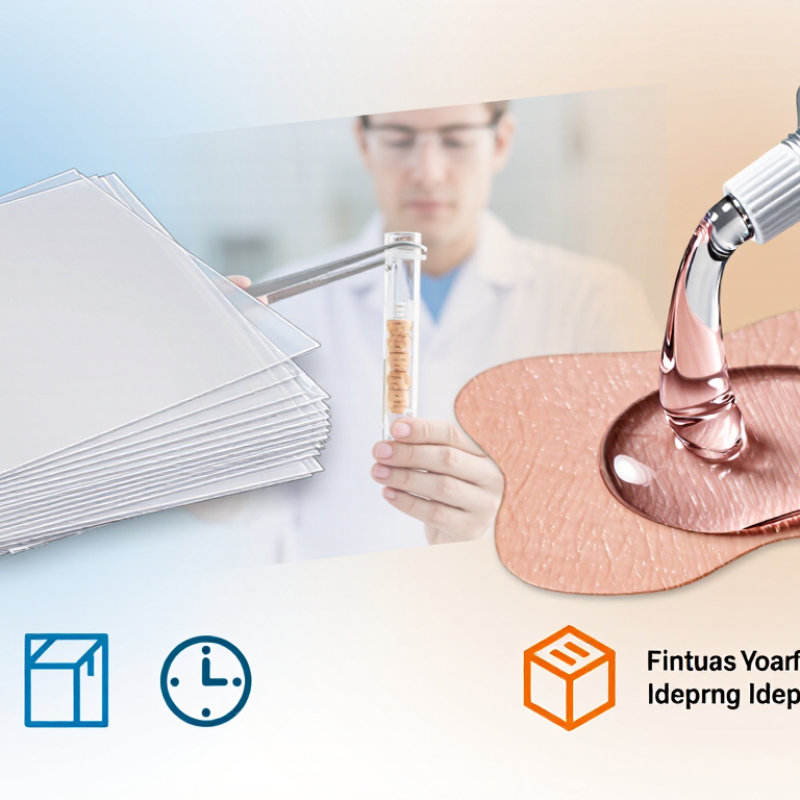
Choosing Between Sheets And Gels is a practical sourcing decision, not a simple product preference. Silicone sheets offer controlled contact, measured thickness, and easy visual inspection. Gels spread quickly, suit irregular scars, and usually require less material per application. The better option depends on skin type, climate, packaging, compliance, and patient routine.
Market evidence shows why this category deserves careful evaluation. Fortune Business Insights reported that the global advanced wound care market reached approximately USD 11.6 billion in 2023, with continued growth expected through 2032. However, most reports combine dressings, foams, films, and gels. They rarely separate scar sheets from silicone gels. That limitation matters. Sourcing decisions should not rely on market size alone.
Dr. Thomas A. Mustoe, a widely cited plastic surgeon and scar-management researcher, described silicone gel sheeting as “the most effective noninvasive therapy for hypertrophic scars and keloids.” His view supports sheets, but it does not make gels irrelevant. Evidence also depends on consistent use, product quality, and patient comfort. A sheet may lift at the edges after exercise. A gel may feel tacky inside a humid warehouse or bathroom. Small details can influence repeat use.
Suppliers should verify silicone composition, thickness, drying time, shelf life, packaging integrity, and regulatory documentation. Independent testing is essential. So is honest comparison.
The cheapest format may create higher returns.
A reliable global sourcing plan should compare landed cost, clinical evidence, manufacturing controls, and user adherence. Reports provide direction, not certainty. The final choice needs both data and practical testing.
Why Choose Between Sheets And Gels For Global Sourcing?
Define Sheets vs. Gels by Coverage, Dose, and Handling Requirements
Sheets and gels solve different sourcing problems. Sheets provide a fixed coverage area, which helps standardize application across production batches. Their dimensions can match a defined surface, reducing guesswork during use. A wider sheet is not always better. Oversized material may create waste, awkward folding, or higher packaging costs.
Gels offer flexible coverage because operators can spread them over uneven or changing surfaces. This flexibility can support varied product designs, but the applied dose requires tighter control. A calibrated pump, measured scoop, or filling check may be necessary. In supplier evaluations, I would compare viscosity, dispensing accuracy, residue, and stability after transport. Small differences matter.
Handling requirements often decide the practical winner. Sheets usually need clean stacking, protective liners, and careful cutting controls. Gels require sealed containers, leak testing, and temperature checks during storage. Cold conditions can increase viscosity, while heat may affect flow and packaging performance. These details deserve physical trials, not only document reviews. I would request samples from multiple production lots and record coverage, dose, and handling time. One trial is not enough. A process that looks efficient in a factory may become difficult during international transit or final packing. Requirements can also vary by destination, so technical files, labeling, and quality records should be reviewed before purchase.
Global sourcing teams often compare sheets and gels as if AQL were a performance score. It is not. ISO 2859-1:1999 defines AQL as a sampling-system parameter for lot acceptance. Under the same inspection plan, AQL 1.5 allows fewer defects than 2.5 or 4.0. The exact acceptance number still depends on lot size and inspection code letter.
For sheet products, AQL 1.5 should support tighter checks on edge tears, surface marks, dimensions, seal strength, and moisture uniformity. ASTM F88/F88M-23 provides a recognized method for measuring flexible-package seal strength. For gel products, buyers should record fill weight, viscosity, leakage, container closure, and separation after temperature cycling. AQL 2.5 may suit controlled cosmetic defects. AQL 4.0 can be practical for lower-risk appearance issues, but it should not excuse leakage or unsafe packaging.
Numbers need context. A 2022 WHO global infection-prevention report emphasizes reliable supplies and consistent quality in care environments. That principle also matters in private-label sourcing. A gel can pass sampling yet perform poorly after transport. A sheet can look clean but lose adhesion in humid storage. I have seen inspection plans focus too heavily on appearance. That is a weakness. A better comparison combines AQL results with functional tests, supplier records, and retained samples.
The uncomfortable question remains: are we measuring real product performance, or only counting visible defects?
Sheets and gels serve different clinical and manufacturing needs. Sheets offer defined thickness, easier cutting, and stable handling during packaging. Gels may provide flexible coverage, but viscosity can change with temperature. Global sourcing should begin with documented quality controls, not appearance alone. Under ISO 13485, review the supplier’s quality management system, risk controls, traceability, and change-control records. A polished certificate is not enough.
ISO 10993 evidence must match the product’s intended contact, duration, and application method. Ask for complete test reports, not only a compliance statement. Review biological endpoints, sample preparation, laboratory credentials, and test dates. For FDA 21 CFR Part 820, examine device history records, complaint handling, CAPA procedures, and nonconformance controls. Packaging and sterilization records also deserve close attention. No supplier file is perfect. Missing details should trigger questions before approval.
Tips: Request a recent batch record and audit summary. Compare material specifications with incoming inspection results. Confirm how formulation, thickness, or packaging changes are communicated. Keep a written gap list, even when documents appear complete. Small gaps can become expensive later.
Why Choose Between Sheets And Gels For Global Sourcing?
Landed cost should guide the sheets-versus-gels decision, not the factory quote alone. Start with the minimum order quantity, or MOQ. A low unit price can still create excess inventory when the MOQ exceeds quarterly demand. Sheets may offer predictable cutting yields, while gels can lose volume during filling, transfer, or application. Measure usable output, not purchased weight. A small yield difference can change the entire calculation.
Add packaging, freight, insurance, duties, handling, and inspection fees. Packaging needs special attention. Rigid trays may protect sheets but increase cubic volume. Sealed pouches can reduce space, yet they may raise material and labor costs. Under Incoterms 2020, compare responsibilities carefully. EXW may leave export and transport tasks with the buyer. FOB usually transfers risk after loading at the named port. CIF includes freight and insurance to the destination port, but risk transfers earlier. DAP places delivery responsibility with the seller, while import clearance usually remains with the buyer.
Tips: Build a landed-cost worksheet for each format. Include MOQ, yield percentage, packaging per unit, freight per carton, duty rate, and local delivery. Request quotations using the same Incoterm and named location. Otherwise, the comparison is weak.
The first estimate is rarely perfect. Actual gel loss may exceed trial data, and sheet damage may appear after ocean transit. Review three shipments before fixing a standard cost. Keep a contingency line. Small surprises become expensive at scale.
Calculation basis: Landed cost is calculated per usable unit after yield loss. The scenario uses a 10,000-unit MOQ and 96% yield for sheets, compared with an 8,000-unit MOQ and 92% yield for gels. Costs include product, packaging, international freight and insurance, plus a 5% import duty applied to product value.
Incoterms 2020: The model assumes an FOB purchase, where the buyer pays the main carriage, insurance and import charges separately. Sheets deliver a lower estimated landed cost of $0.55 per usable unit, while gels reach approximately $0.68 per usable unit because of higher packaging requirements and lower yield.
Illustrative non-branded benchmark using market-realistic sourcing assumptions. Final landed cost should be recalculated with supplier quotations, tariff classification, destination charges and confirmed Incoterms.
Why Choose Between Sheets And Gels For Global Sourcing?
Selecting between sheets and gels should begin with supplier evidence, not material preference. A quality scorecard can track defect rates, batch consistency, test results, and corrective-action speed. Ask for three consecutive production records. One attractive sample proves little.
Lead time needs equal attention. Measure quoted days, actual days, variance, and port-to-warehouse performance. The World Bank’s 2023 Logistics Performance Index shows major differences in shipment predictability across markets. UNCTAD also reports that over 80% of global merchandise trade moves by sea. A two-day delay can become a serious production gap when containers miss a sailing. Build separate scores for manufacturing time and transport time. Do not hide them inside one average.
Risk data makes the comparison more useful. Review financial stability, capacity concentration, audit findings, geographic exposure, and backup production. The World Economic Forum’s Global Risks Report 2024 identifies supply-chain disruption as a continuing business concern. Use a weighted scorecard, such as quality at 40%, lead time at 30%, and risk at 30%. Adjust those weights for medical, industrial, or consumer applications. The uncomfortable part is that scoring can create false confidence. Data may be incomplete, outdated, or self-reported. Recheck critical figures through certificates, production visits, and small trial orders. Measure the evidence. Not assumptions.
Anonymized supplier scorecard for comparing sheet and gel formats across quality, delivery, commercial, and supply-chain risk dimensions.
| Supplier ID | Product Format | Primary Material | Quality Performance | Lead-Time & Commercial Data | Supply-Chain Risk Scorecard | Weighted Score | ||||||||
|---|---|---|---|---|---|---|---|---|---|---|---|---|---|---|
| Conformance Rate | Dimensional Tolerance | Lot-to-Lot Consistency | Documentation Completeness | Sample Lead Time | Production Lead Time | Minimum Order Quantity | On-Time Delivery | Geographic Exposure | Capacity Resilience | Overall Risk | ||||
| Supplier 01 | Sheet | Hydrocolloid polymer sheet | 98.6% | ±0.20 mm | High | 99% | 7 calendar days | 28 calendar days | 5,000 units | 96% | Low | High | Low | 91 / 100 |
| Supplier 02 | Gel | Water-based polymer gel | 97.9% | ±0.15 mm | High | 97% | 5 calendar days | 24 calendar days | 3,000 units | 94% | Medium | High | Low | 89 / 100 |
| Supplier 03 | Sheet | Cross-linked polymer sheet | 95.8% | ±0.25 mm | Medium | 96% | 10 calendar days | 35 calendar days | 10,000 units | 91% | Medium | Medium | Medium | 80 / 100 |
| Supplier 04 | Gel | Silicone-compatible gel compound | 96.4% | ±0.18 mm | Medium | 95% | 8 calendar days | 31 calendar days | 7,500 units | 92% | Low | Medium | Medium | 83 / 100 |
| Supplier 05 | Sheet | Biopolymer-based sheet | 94.7% | ±0.30 mm | Medium | 93% | 12 calendar days | 42 calendar days | 8,000 units | 88% | High | Medium | High | 73 / 100 |
| Supplier 06 | Gel | Hydrogel formulation | 98.1% | ±0.12 mm | High | 98% | 6 calendar days | 26 calendar days | 4,000 units | 95% | Low | High | Low | 90 / 100 |
| Supplier 07 | Sheet | Thermoplastic elastomer sheet | 96.0% | ±0.22 mm | High | 94% | 9 calendar days | 30 calendar days | 6,000 units | 93% | Low | High | Low | 86 / 100 |
| Supplier 08 | Gel | Silicone-free aqueous gel | 95.5% | ±0.20 mm | Medium | 92% | 7 calendar days | 29 calendar days | 5,000 units | 90% | Medium | Medium | Medium | 79 / 100 |
| Scoring basis: Weighted score combines quality conformance (35%), delivery performance (25%), lead-time competitiveness (15%), commercial flexibility (10%), and supply-chain risk (15%). Risk ratings consider geographic concentration, documented business continuity planning, capacity redundancy, logistics dependency, and historical delivery performance. Data is presented as an anonymized sourcing benchmark for evaluation and should be validated through audits, samples, and current supplier documentation. | ||||||||||||||
No. AQL is a sampling parameter for accepting or rejecting a production lot. AQL 1.5 allows fewer defects than 2.5 or 4.0. Lot size and inspection level still affect the final acceptance number. It does not measure every product characteristic.
Check edge tears, surface marks, dimensions, seal strength, and moisture uniformity. A clean surface is not enough. Test flexible-package seals with a recognized seal-strength method. Humidity can later reduce adhesion.
Record fill weight, viscosity, leakage, closure quality, and separation. Use samples after temperature cycling. A gel may pass initial inspection but separate during transport. That matters.
AQL 2.5 may suit controlled appearance defects. AQL 4.0 may suit lower-risk cosmetic issues. Neither level should excuse leakage or unsafe packaging. Risk comes first.
Include MOQ, usable yield, packaging, freight, insurance, duties, handling, and inspection fees. Calculate usable output, not purchased weight. Gels may lose volume during filling or transfer. Sheets may create more predictable cutting yields. The factory quote is only one piece.
Rigid trays can protect sheets but increase shipping volume. Sealed pouches may save space but add material and labor costs. Compare packaging cost per unit and freight per carton. Small changes become expensive at scale.
Use the same trade term and named location for every quotation. Under EXW, the buyer may manage export and transport tasks. Under FOB, risk usually transfers after loading at the named port. Under CIF, freight and insurance reach the destination port, but risk transfers earlier. Under DAP, the seller handles delivery, while import clearance usually remains with the buyer.
Review three consecutive production records, defect rates, test results, and corrective-action speed. Measure quoted lead time, actual lead time, variance, and port-to-warehouse performance. Check financial stability, capacity concentration, audit findings, and backup production. Self-reported data can be incomplete. Recheck critical claims.
Combine AQL results with functional tests, supplier records, retained samples, and shipment reviews. Inspect samples after transport, not only at the factory. Review at least three shipments before fixing a standard cost. Keep a contingency line. The first estimate is rarely perfect.
Choosing Between Sheets And Gels for global sourcing requires more than comparing product formats. Sheets and gels should first be evaluated by coverage area, dosage, application method, storage conditions, and handling requirements. Performance data should then be reviewed against appropriate AQL benchmarks, including 1.5, 2.5, and 4.0, to understand defect tolerance and quality consistency. Suppliers should also provide clear evidence of compliance with ISO 13485, ISO 10993, and FDA 21 CFR Part 820 requirements, supported by controlled documentation and traceable processes.
A complete sourcing decision must include landed-cost analysis. This should account for minimum order quantities, production yield, packaging configuration, freight, duties, and the selected Incoterms 2020 arrangement. Finally, suppliers can be compared through a practical scorecard covering quality history, lead-time reliability, communication, capacity, and overall supply-chain risk. By combining technical suitability, regulatory readiness, commercial transparency, and measurable supplier performance, buyers can select the format and sourcing partner that best support consistent quality and long-term operational efficiency.